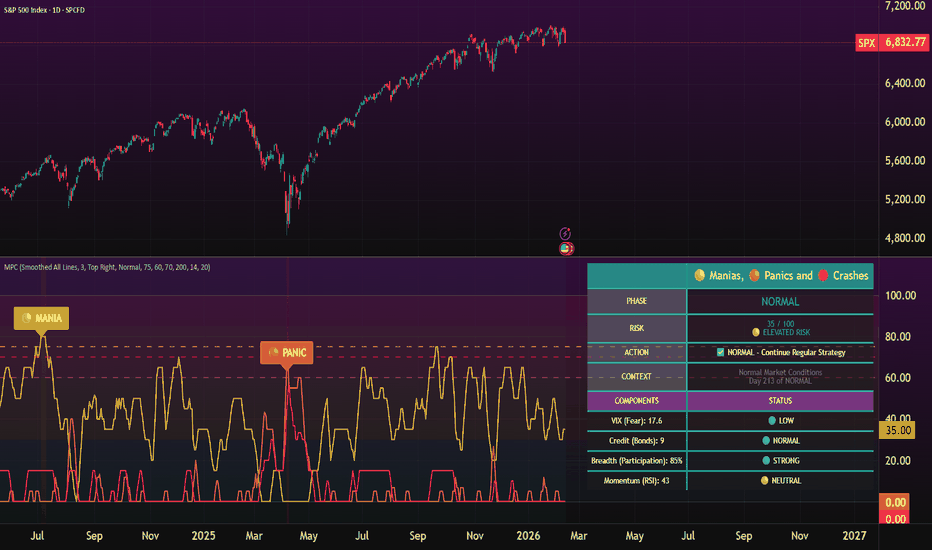
A rising stock market can create a powerful sense of optimism, but headline gains do not always tell the full story. An index may reach new highs while most of its constituent stocks struggle to advance. In such situations, the apparent strength of the market can conceal underlying weakness, leaving investors exposed if a small group of influential companies loses momentum.
Understanding index dispersion and market breadth helps traders look beyond headline performance. These measures reveal how gains are distributed across the market, whether participation is expanding, and how sustainable a rally might be. By examining these signals together, traders can develop a more balanced view of market conditions and make better-informed decisions.
Understanding Index Dispersion and Market Breadth
Index dispersion describes the differences in performance among the individual securities within a market index. When constituent stocks produce widely varying returns, dispersion is high. When their performance remains relatively similar, dispersion is low. High dispersion can indicate that company-specific developments are driving returns, while low dispersion may suggest that a common market trend or macroeconomic influence is affecting most constituents.
Market breadth, by contrast, measures how many securities are participating in a market movement. A rally supported by a large proportion of advancing stocks generally demonstrates broader participation than one driven by a handful of heavily weighted companies. Common breadth indicators include the advance-decline line, the percentage of stocks trading above their moving averages, and the number of stocks reaching new highs compared with new lows.
Although these concepts are related, they measure different aspects of market behaviour. Dispersion focuses on differences in individual returns, whereas breadth examines the extent of participation. A market can experience high dispersion with many stocks advancing, provided their gains vary considerably. Alternatively, an index can rise sharply while breadth deteriorates because a few large constituents account for most of its performance.
Why Index Performance Can Misrepresent Market Strength
Capitalisation-weighted indices give larger companies greater influence over the index’s movement. This structure is useful for representing the performance of the overall market value, but it can obscure the experience of the average constituent. When a few major companies rally strongly, their gains can offset stagnation or losses elsewhere, creating an impression of widespread strength that the underlying data does not support.
Consider an index that rises by 4% over several weeks while most of its constituents remain flat or decline. The advance may reflect strong earnings from a few influential companies, enthusiasm surrounding a particular industry, or expectations about future interest rate changes. Although the index is moving higher, the narrow participation suggests that the rally depends on relatively few contributors. A reversal in those leading stocks could therefore have an outsized effect on the broader benchmark.
This distinction matters when evaluating opportunities through indices trading, where decisions often depend on interpreting benchmark movements rather than selecting individual shares. Traders who assess only price direction may overlook weakening participation, while those who examine breadth and dispersion can identify potential vulnerabilities earlier. Neither measure predicts an inevitable reversal, but both provide context that can improve risk assessment.
Indicators That Reveal the Quality of a Rally
The advance-decline line is a useful starting point because it tracks the cumulative difference between advancing and declining stocks. When the line rises alongside the main index, participation is generally improving. If the index continues climbing while the advance-decline line falls, the divergence suggests that fewer stocks are supporting the move. This does not automatically signal a market top, but it warrants closer examination.
Moving-average breadth offers another perspective. Traders can monitor the proportion of constituents trading above their 50-day or 200-day moving averages to assess short-term and longer-term participation. An increasing percentage above these levels may indicate that strength is spreading across the market. A declining percentage during an index rally can suggest that leadership is becoming concentrated, particularly when fewer stocks maintain their established uptrends.
Dispersion measures add further detail by showing how differently constituents perform over a given period. Traders may compare the returns of individual stocks, sectors, and the index itself to identify whether performance is becoming more uneven. Combining these observations provides a clearer picture than relying on any single indicator. The key is to evaluate consistent patterns rather than reacting to isolated daily movements.
Conclusion
Index dispersion and market breadth offer complementary ways to assess the quality of a rally. Dispersion reveals how unevenly returns are distributed, while breadth shows whether the advance is supported by a substantial portion of the market. Together, they help distinguish broad participation from gains concentrated among a small number of influential stocks.
The most effective use of these indicators is not to predict every market reversal, but to strengthen the decision-making process. By combining participation data with price analysis, risk management, and an awareness of changing economic conditions, traders can develop a more complete understanding of market behaviour. A rising index may attract attention, but examining what lies beneath its performance can provide the perspective needed to approach opportunities with greater discipline and confidence.